The Backtest Claimed +60% in 11 Months. Ours Found Zero Winning Configurations.
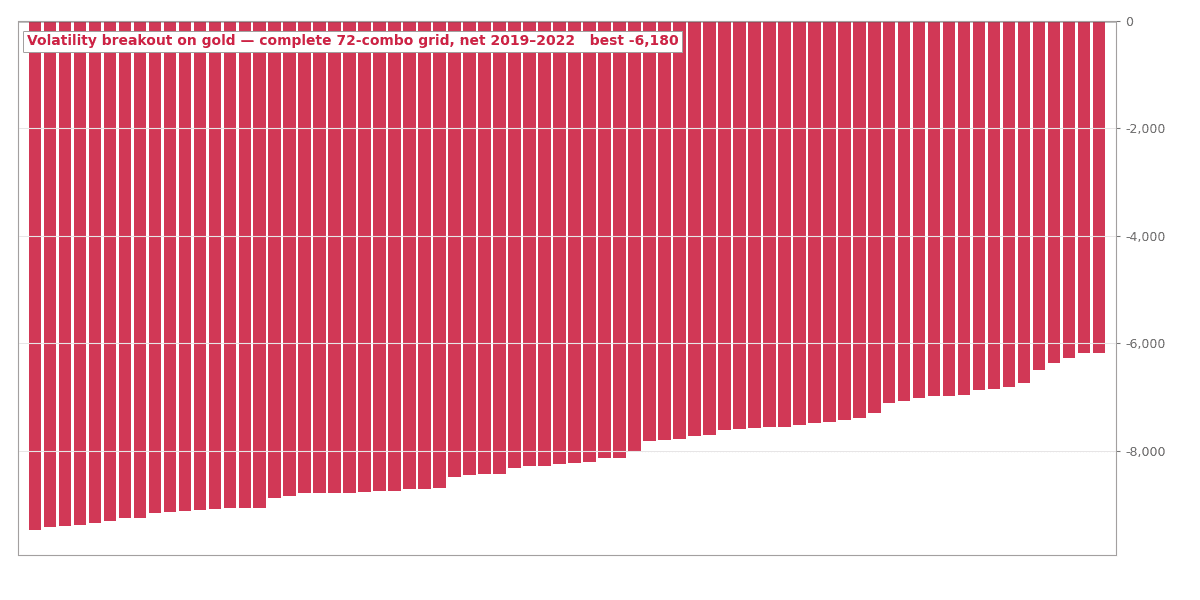
A published gold trading strategy came with a spectacular backtest. We retested the same rules on three years of tick data with real costs and swept the complete parameter grid: all 72 combinations lost money. A case study in why single-period, cost-free backtests can't be trusted.
Larry Williams' volatility breakout is a classic. When price moves a meaningful fraction of yesterday's range away from today's open, that is real order flow rather than noise, so you go with it. An MQL5 article implemented it for gold and reported the kind of backtest that sells EAs: +60% in 11 months, "steady progression," no extreme drawdowns.
The fine print is easy to miss. The test covered January to November 2025 only, one hand-picked year on daily bars in one of gold's great bull runs, and it charged zero commission.
Our version of the test
Same rules, implemented faithfully. Buy when price closes above
day open + K x yesterday's range (mirror short below), stop at a fraction
of yesterday's range, take-profit at a reward multiple, one trade per day,
flat before the next day's levels.
Instead of one lucky year, we ran the complete parameter grid: every combination of breakout multiple (0.3 to 0.8), stop multiple (0.3 to 0.7) and reward ratio (2 to 5), 72 in all, over 2019 to 2022 on real tick data with commission included. Not a genetic sample that might miss pockets. Every cell of the space.
All 72 lost money. The best combination finished at −$6,180 on $10,000, and the worst near −$9,500. There was no corner of the parameter space to rescue, and no "with better tuning" left on the table.
A data convention worth knowing about
One market-structure detail matters for anyone testing daily-level systems on UTC data: the Sunday-evening open creates tiny "Sunday" daily bars (a $3 to $6 range versus $11 to $60 for real trading days). Any "yesterday's range" logic must treat Mondays specially, using Friday's full range, and never trade the Sunday stub itself, or roughly 20% of trades run on corrupted levels. Our implementation handles this, and every number in this post reflects it.
Why the same rules produce opposite backtests
Three differences between their test and ours explain everything:
- Costs. With around 150 trades over three years paying spread and commission on every round turn, the cost drag alone consumes several percent per year before the strategy earns anything.
- The stop sits inside gold's noise. Stops at 0.3 to 0.7 times yesterday's range were routinely hit within minutes. Win rates ran near 20%, while the reward targets of 2 to 5 times the stop rarely filled before the 23-hour time exit.
- One year versus three. Gold's 2025 melt-up rewarded any long-biased breakout. Sweep 2019 to 2022, with its chop, crash, rally and range, and the melt-up year's flattery disappears.
None of this makes the source article dishonest. It makes it a single-period, cost-free demonstration, which is what most published backtests are. The retest is what tells you whether there is a strategy underneath the demonstration. Here there wasn't.
A note on the breakout family
This is our second data point on breakouts. The Asian-session range breakout, a session-anchored cousin of this idea, showed a genuine multi-year edge on USD/JPY while failing on EUR/USD. This daily-open volatility expansion fails on gold outright. The family label tells you very little; what matters is the specific mechanism on the specific instrument.
Like our RSI(2) gold test, this strategy was rejected at the in-sample stage. Nothing survived optimization, so our locked out-of-sample window (2022 to 2026) was never touched. Total cost of the answer: one afternoon of compute.
All tested strategies, winners and losers, live on the results page.
Past performance is not indicative of future results. These are backtests with realistic cost assumptions, not live trading records.