One Breakout Strategy, Two Currency Pairs, Two Opposite Endings
The Asian-session range breakout that started this whole project: +$35k on USD/JPY, −$5k on EUR/USD — identical rules, identical timing. What five years of tick data taught us about testing across instruments.

Before the research pipeline, before the robustness gates, there was one hand-built strategy and a simple question: does the Asian session range mean anything once London and New York wake up?
This is the strategy that started this whole project — and the result that shaped how we test everything since.
The rules
Nothing exotic. Fully mechanical, six lines:
- Measure the high and low of the Asian session window (01:00–04:00 UTC) — that's the range
- If price closes above the range high, go long; closes below the low, go short
- Enter on the next candle open
- Stop loss at the opposite end of the range
- Exit at the end of the trade window or when stopped out
- Max one trade per day
Tested on 2021–2025 Dukascopy tick data: $10,000 start, 1% of equity risked per trade, commission included. An optimizer swept every viable session window (starts from midnight to 6 AM UTC, minimum three hours) and ranked the results — 1 AM to 4 AM UTC won on both pairs.
Same rules, opposite outcomes
Then we ran identical rules on two of the most-traded pairs in the world:
| USD/JPY | EUR/USD | |
|---|---|---|
| Net result | +$35,143 ($10k → $45.1k) | −$5,245 ($10k → $4.8k) |
| Trades | 1,289 | 1,301 |
| Profit factor | 1.27 | 1.00 |
| Win rate | 40.9% | 30.1% |
| Max drawdown | 17.8% | 72.5% |
Same logic. Same window. Nearly the same number of trades. One account more than quadrupled; the other lost half its capital and spent three straight years digging deeper:
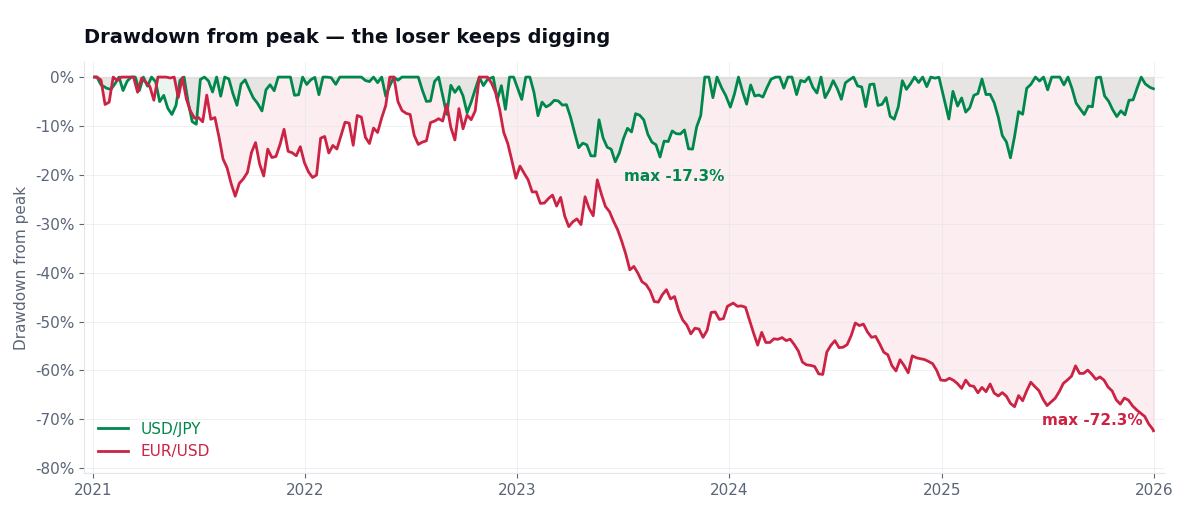 Drawdown from peak, 2021–2025 — USD/JPY stays shallow while EUR/USD grinds to −72%
USD/JPY was positive in all five years — including a +6.6% grind in 2023 that tested patience but never the account. EUR/USD flipped negative in 2023 and never recovered. A profit factor of exactly 1.00 means EUR/USD's gross wins and losses cancelled perfectly — every dollar it lost was, in effect, transaction costs.
Why would the same edge exist on one pair and not the other?
Our working explanation: the Asian session means something for USD/JPY — it's the yen's home session, so the range genuinely summarizes local positioning, and the London/NY follow-through breaks it with intent. For EUR/USD, the Asian session is the quiet shift; its range is mostly noise, and noise breakouts are coin flips that lose the spread.
Whatever the mechanism, the practical lesson is blunt: a strategy is not "validated" until it's been tested on every instrument you intend to trade — and an instrument is not validated by its neighbor. If we had only tested EUR/USD, we'd have binned a real edge. Only USD/JPY, and we'd have deployed capital on a pair where the edge doesn't exist.
What we'd demand of this strategy today
Honesty requires a caveat: this test predates our current pipeline. The session window was optimized over the same 2021–2025 period it was scored on — there was no held-out data. That doesn't erase five consecutive profitable years on USD/JPY, but by the standards we now apply to every strategy (in-sample optimization strictly separated from a one-shot out-of-sample window, parameter-plateau selection, cost stress, retention gates), these numbers count as in-sample evidence — encouraging, not conclusive.
That stricter standard exists in part because of this strategy: the EUR/USD result showed us how easily a plausible idea can be nothing but costs and noise. You can see the full discipline applied in our Tokyo-fix anomaly study, where it rejected a profitable strategy for degrading too much out-of-sample.
The complete interactive results — equity curves, drawdowns, yearly breakdowns for both pairs — are on the results page.
Past performance is not indicative of future results. These are backtests with realistic cost assumptions, not live trading records.