We Finally Tested Our First Strategy the Hard Way. The Edge Held.
The Asian-session breakout that started this project was only ever tested in-sample. So we ran it through the full pipeline: a frozen out-of-sample window, a cost-stress rerun, 10,000 Monte Carlo resamples, and a beat-the-baseline check. It survived all four.
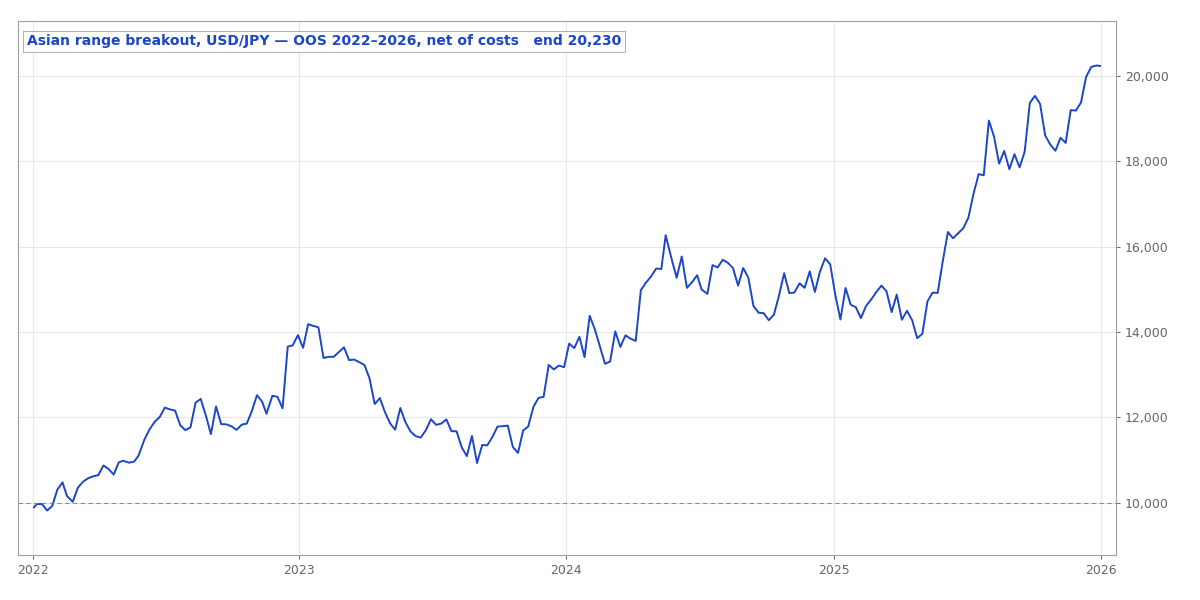
A few days ago I wrote about the strategy that started this whole project: a plain Asian-session range breakout on USD/JPY. It made $35,000 on paper, and I ended that post with a confession. The session window had been optimized over the same years it was scored on. No held-out data. Encouraging, I said, not conclusive.
That kind of sentence bothers me. So I did the obvious thing and ran the strategy through the actual pipeline, the same one that has rejected most of what we have thrown at it. This is what came back.
What the strategy does
The rules never changed, and they are still boring:
- Measure the high and low of the Asian session (the quiet hours before London wakes up). That is the range.
- If a candle closes above the range high, go long. Below the low, go short.
- Stop loss sits at the opposite end of the range.
- Flatten at a fixed hour in the afternoon if the trade is still open.
- One trade per day, USD/JPY only.
USD/JPY only, because when I first tested these exact rules on EUR/USD the account lost half its value and the profit factor came out at 1.00, which is a polite way of saying every dollar it made went to the spread. The Asian range means something on the yen's home session and nothing on EUR/USD. So the honest test is the pair where a mechanism plausibly exists.
The difference this time: a wall between the two halves
The demo optimized and scored on 2021 to 2025 at once. That is the mistake the whole pipeline exists to prevent, because an optimizer handed the answer key will always find a window that looks brilliant in hindsight.
This run splits the data with a hard wall. The optimizer only ever saw 2019 to 2022. It picked its session window and exit hour there, I froze those parameters, and then I ran them exactly once on 2022 to 2026, a stretch of price the optimizer had never touched. If the edge was just a curve fit, this is where it dies.
In-sample it made $9,295 at a profit factor of 1.21. Fine, but in-sample numbers are supposed to look fine. The question is the next chart.
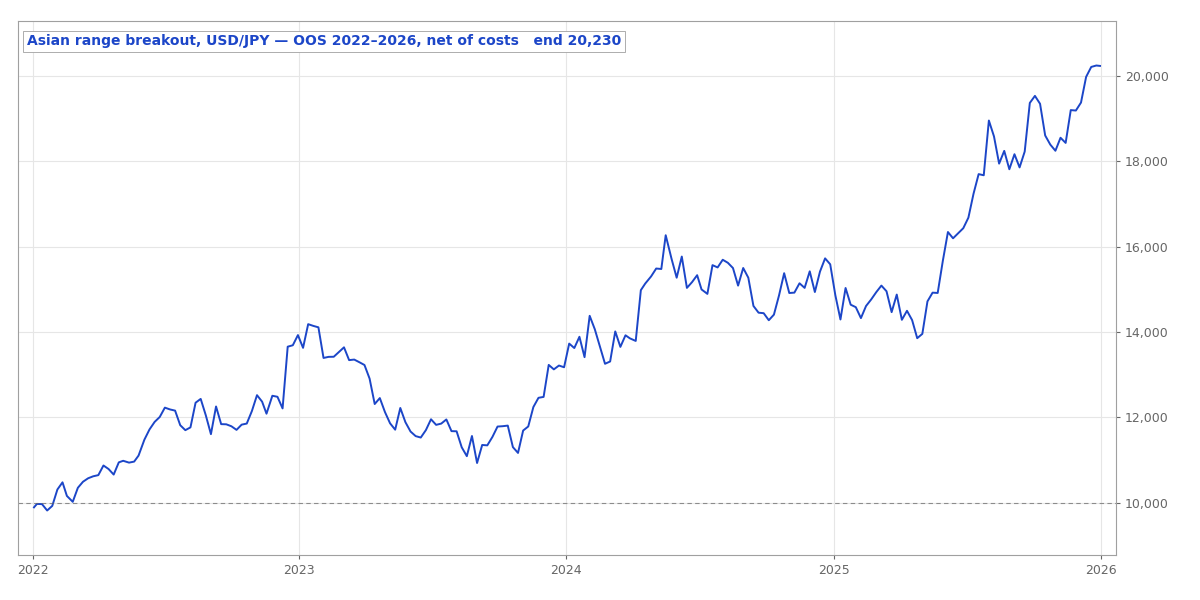 Out-of-sample equity on USD/JPY, 2022 to 2026, net of modeled commission. $10,000 grew to $20,230 with a real drawdown in 2023.
Out of sample, on data used for scoring and nothing else, $10,000 became $20,230. That is $10,230 of net profit across 1,012 trades, a profit factor of 1.16, and roughly 19% a year. The profit factor kept 96% of its in-sample value, which almost never happens with an overfit strategy. Usually the edge falls off a cliff the moment you show it fresh data. This one barely flinched.
It is not a smooth ride. You can see the 2023 stretch where the account fell from $14,000 back toward $11,000 and sat there for months. The worst drawdown was 23.7%. Win rate is under half, at 45.75%, and the whole thing works because the winners ($157 on average) are bigger than the losers ($114). That is the signature of a breakout: wrong often, but right when it counts.
One good backtest is not evidence
A single equity curve, even an honest out-of-sample one, is one path through history. It could still be luck wearing a nice suit. So the pipeline now puts every survivor through three more checks that cost no extra backtest, and this was the first strategy to face all three.
Double the trading costs. I reran the exact out-of-sample trades with commission set to $8.50 per side instead of the $3.50 we model, more than any retail broker charges. The strategy still made $5,445 at a profit factor of 1.08. Thinner, obviously, but it does not depend on unrealistically cheap fills.
Resample the trades 10,000 times. This is the one I care about most. Take the 1,012 trades, draw them at random with replacement, and rebuild the account ten thousand times over. Only 4% of those alternate histories lost money. The median rebuild made $10,111, almost exactly the real figure. I will not pretend it is bulletproof: in the unluckiest 2.5% of draws the profit factor slips just under 1.00, so the edge is real but not fat. And when I shuffle the actual trade order, the drawdown can reach 41% in a bad sequence even though the real run only hit 24%. Anyone sizing this needs to plan for the 41%, not the 24%.
Each run reshuffles the 283 out-of-sample trades, drawing them with replacement, and totals the result. The blue line is what actually happened; the shaded band left of zero is every run that ended in the red.
The reassuring part: the real drawdown landed at the 50th percentile of those shuffles, dead average. A strategy whose published drawdown is quietly the luckiest number it could have printed is the one that hurts you later. This one is honest about its own risk.
Beat the dumb baseline. A strategy earns its complexity only if it beats what you could have done with no strategy at all. So I compared its risk-adjusted return, annual return divided by drawdown, against just holding USD/JPY and against a mindless trend follower that goes long whenever the past year was up.
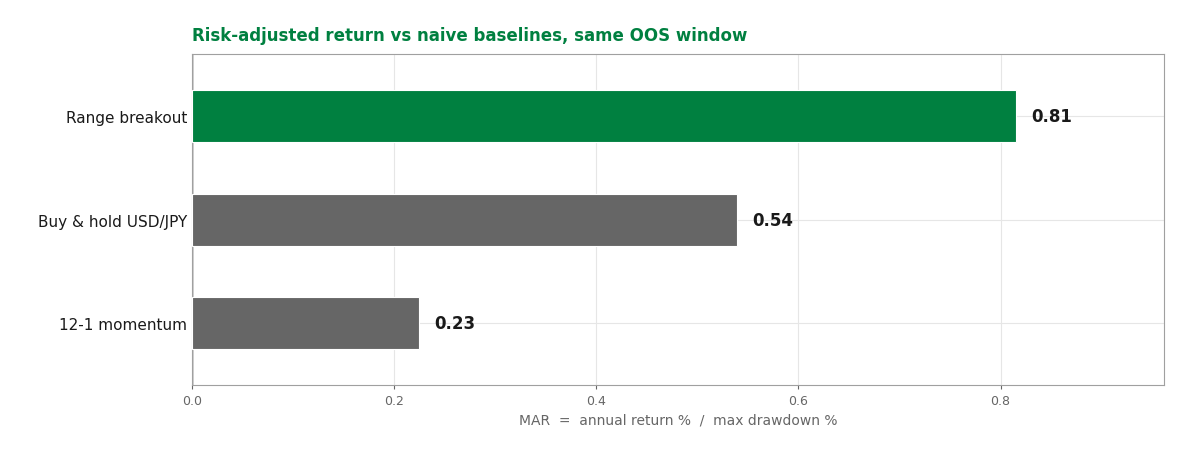 Risk-adjusted return (MAR) versus naive baselines over the same out-of-sample window. The breakout scores 0.81 against 0.54 for buy-and-hold and 0.23 for 12-month momentum.
The breakout scored 0.81 against 0.54 for buy-and-hold and 0.23 for the trend follower. It beat the best naive option by half again. That matters to me because the last strategy I ran this check on, a Bitcoin trend system, lost to the dumb trend follower by more than four to one, and without this gate it would have shipped looking respectable. The breakout passes on its own merits.
So why is it not on the live list?
Because passing the honesty checks is not the same as being good enough. Two bars it does not clear: our house rule caps a shippable strategy at 20% drawdown, and this one draws down 24%. And our in-sample profit factor bar is 1.30, while this came in at 1.21. Real, robust, honest about its risk, and still a notch below where I would put live money.
That combination used to have only two outcomes here, shipped or killed, and neither fit. So this is the first strategy we are marking for forward testing instead. It goes into a tracked paper account and trades on data that does not exist yet, the only test that no amount of clever backtesting can fake. If the edge is real, it keeps working on next quarter's prices. If it was a ghost, forward testing is where it finally admits it. Either way, we find out in public.
That is a strange kind of happy ending for the strategy that kicked off the project. It came back not with a trophy and not with a tombstone, but with a "maybe, let's watch." Which, if I am honest, is the most a backtest should ever earn.
The full metrics, equity curve, and yearly breakdown are on the results page.
Past performance is not indicative of future results. These are backtests with realistic modeled costs, not live trading records.