Honestly Mediocre: the Bitcoin Trend Strategy That Passed the Overfit Test and Failed the Quality Bar
A Donchian breakout on BTC H4 made 7.8% a year across four unseen years with textbook retention numbers. We rejected it on absolute quality, and the same rules on H1 lost 60 times out of 60.
There are two ways a backtest can reject a strategy. The common one is exposure: the edge was never real, and unseen data says so. The rarer one is what happened here. The edge is real, it showed up across four years the optimizer never saw, and the strategy still is not good enough to trade. We think this second kind is worth publishing in detail, because in the wild it gets sold as validation.
Why Donchian on Bitcoin
Turtle-style channel breakouts are the oldest public trend system there is: buy when price makes a new N-bar high, exit on a new M-bar low, let the stop be a formality and the exit do the work. We put it on Bitcoin because the trend argument is strongest there (reflexive adoption and liquidation cycles) and because the cost geometry is the mirror image of our failed gold mean-reversion test. A trend system's winners are huge relative to spread; costs stop mattering. After watching spread kill the RSI(2) system, we wanted the opposite failure surface.
The rules we froze: long when the last completed H4 close is the highest close of the past 10 bars and above the 50-bar channel midline, exit on the lowest close of the past 15 bars, 1.5x ATR disaster stop, one position at a time, 1% of equity risked per trade.
The timeframe experiment
We ran the identical 60-combination grid twice: once on H4, once on H1. Same market, same rules, same 2019 to 2022 window.
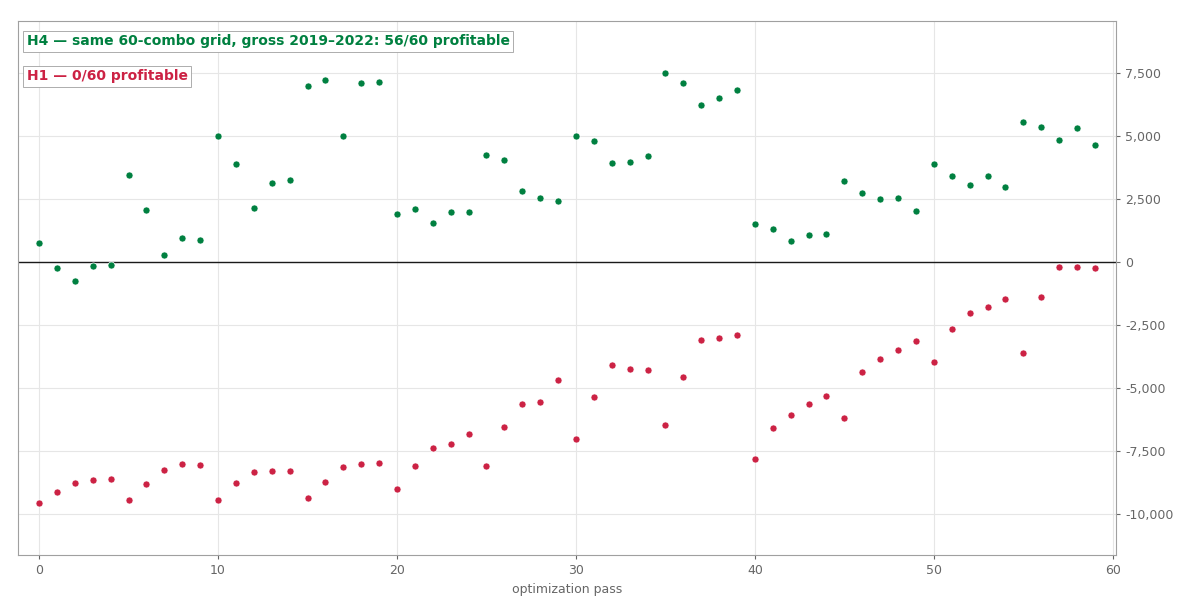 The same 60-combination Donchian grid on Bitcoin, 2019 to 2022, gross. H4 in green: 56 of 60 profitable. H1 in red: 0 of 60.
On H4, 56 of 60 combinations made money. On H1, zero of 60 did. Not "few". Zero. Whatever trend persistence Bitcoin has, it lives at swing scale and drowns in hourly noise, where the channel exit gets whipsawed to death. We keep relearning the same lesson from different directions: timeframe belongs in the strategy definition, next to the entry rule, not in the chart settings.
Out-of-sample: profitable, and not good enough
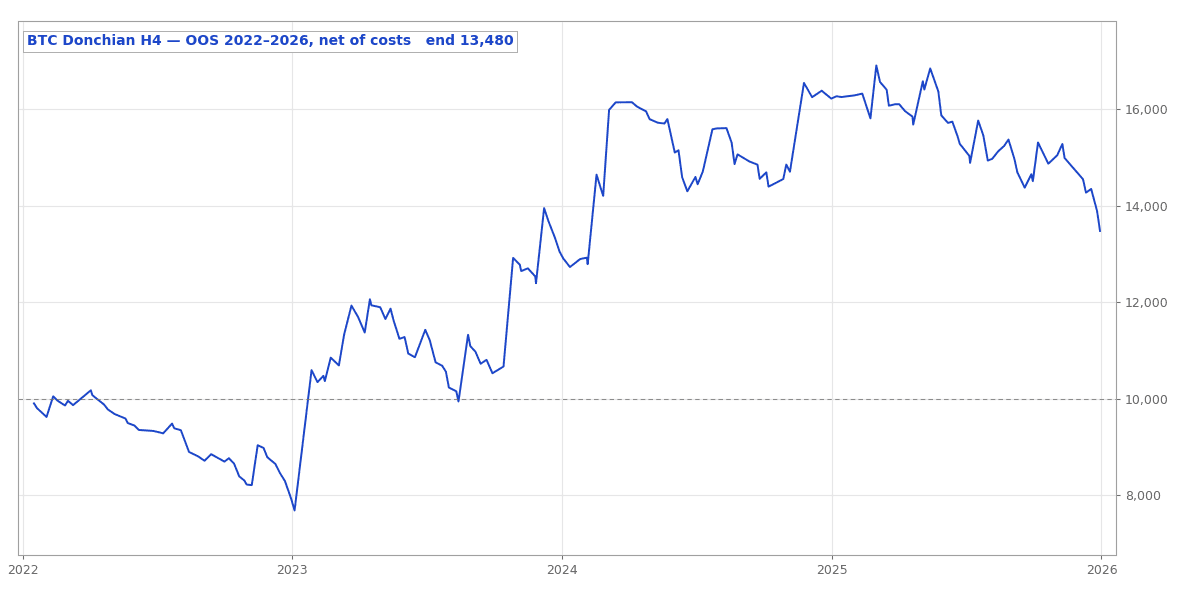
The frozen candidate went to 2022 to 2026 exactly once. It made +$3,479.93 net on a $10,000 account, about 7.8% a year, across 327 trades, with commission modeled at $3.50 a side per lot on real tick data.
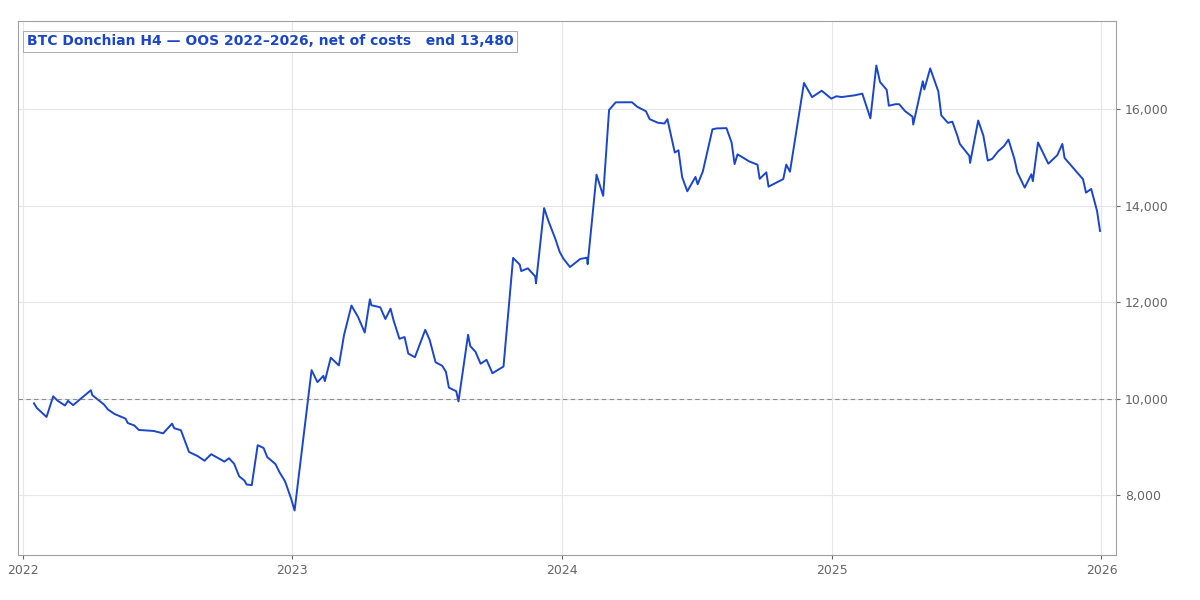 Out-of-sample equity, 2022 to 2026, net of modeled commission. The ride matters as much as the destination: most of 2022 was spent underwater.
The retention numbers are what an honest edge looks like. Profit factor kept 83% of its in-sample value against our 70% bar. Annualized return kept 52% against a 50% bar. The out-of-sample drawdown was smaller than the in-sample one. The parameter neighborhood was profitable in every direction. Nothing about this says curve-fit.
And it still failed, on three absolute gates at once: profit factor 1.121 against a 1.15 minimum, max drawdown 25.2% against a 20% cap, and per-trade Sharpe 0.030 against a 0.05 floor. The retention gates ask whether the edge survived. The absolute gates ask whether it is worth owning, and the answer was no.
What a 24% win rate does to people
The strategy wins 24.5% of the time. The average winner ($402.50) is three and a half times the average loser ($116.27), so the arithmetic works out fine. Living with it is another matter. Three of four trades lose. The account spent most of 2022 in a drawdown that bottomed around 23% before the first big trend arrived to pay for it all. On a chart, that is one bad year inside a profitable four; in real time, that is twelve months of watching a system lose other people's patience.
We also disclose one flattering artifact: the tester charged no swap on BTC positions, and a swing system holds overnight by design. Real results would be somewhat worse than everything shown here.
How much of that was luck?
A single out-of-sample run is one path through history. So before trusting even a rejected result, we resample it: draw the 327 trades over again, ten thousand times, and rebuild the account each way.
Each run reshuffles the 283 out-of-sample trades, drawing them with replacement, and totals the result. The blue line is what actually happened; the shaded band left of zero is every run that ended in the red.
The answer is not reassuring. Almost a third of those alternate histories, 30.5%, finished in the red. The median rebuild made about $3,200, close to what actually happened, but the spread is enormous, and the unluckiest few lost more than $8,500. An edge that loses money in three replays out of ten is not thin, it is fragile.
The drawdown is worse than the chart admits. The 25% we reported sat at the 7th percentile of reshuffles, which means the real run drew a gentle ordering. A typical sequence of the very same trades bottoms near 36%, and the ugly ones reach 61%. The published drawdown was the lucky number, not the expected one.
Then the baseline that settles it. We compared the strategy's risk-adjusted return against the dumbest trend-follower we could write: go long Bitcoin whenever the past year was up, sit out otherwise. That one rule returned about 31% a year at a MAR of 1.43. Our carefully optimized Donchian system managed a MAR of 0.31. The thing we were supposed to beat beat us by more than four to one. When a strategy loses to the trivial version of its own idea, the complexity is not earning its keep.
None of this reverses the earlier verdict. It sharpens it. The retention gates said the edge was real; the robustness checks say it is real, fragile, drawdown-lucky, and worse than doing the obvious thing.
What we take from it
The overfit test and the quality test are different tests. Retention gates catch strategies that lied in-sample; absolute gates catch strategies that told the truth and the truth was underwhelming. This one passed the first and failed the second, which is exactly the profile of systems that survive for years in forums and vendor catalogs: they really do make money in backtests, on the right years, for whoever can stomach the ride. "Profitable out-of-sample" is a necessary condition. It was never the finish line.