The London Fix Reversal: a Real Anomaly That Pays Less Than a Savings Account
We tested the WM/R 4pm fix reversal on 7 years of GBPUSD tick data. It passed 11 of our 12 gates and we still rejected it. The one that failed is the one that matters.
Most strategy rejections are boring: the edge was never there, the backtest says so, everyone moves on. This one is different. The London fix reversal passed eleven of our twelve validation gates, kept 88% of its profit factor across four unseen years, and survived a doubling of commission. We rejected it anyway, and the reason is worth writing down: the anomaly is real and it pays about 70 basis points a year.
The paper trail
Benchmark-tracking funds execute at the WM/R fix, 4pm London time. Their orders push spot in the minutes before the benchmark window, and Evans (2017) showed the move partially reverts afterwards, with the effect strongest at month-end when rebalancing flows peak. The Norges Bank studied the same mechanics, and a 2024 replication kept the story alive.
There is a catch, and we knew it going in. The strong results come from pre-2015 data. In 2015, after the fix-rigging scandal, the benchmark window was widened from one minute to five, and most of the documented reversal disappeared with it. Our data starts in 2019. So this test was never "does the famous anomaly work": it was "is there any residue left". Rejection was the expected outcome. The surprise was the form it took.
The rules we tested
- Measure the move in the 15 minutes going into the 4pm London fix (16:00 London, converted to UTC with proper last-Sunday DST rules)
- If the pre-fix move is down by at least 15 pips, buy at the first M5 bar at the fix. If it is up by at least 15 pips, sell. Always fade the pressure.
- Hard time exit 30 minutes after entry, fixed 30-pip stop loss
- One trade per fix, at most one per weekday, risking 0.5% of equity
GBPUSD, Dukascopy tick data, $10,000 start, commission modeled at $3.50 per side per lot, swaps charged natively. In-sample optimization 2019 to 2022, out-of-sample 2022 to 2026 run exactly once on the frozen candidate. This strategy consumed one out-of-sample run, total.
In-sample: the anomaly shows up everywhere
We optimized only three parameters (threshold, holding time, stop) across 48 combinations, and 42 of 48 finished gross-profitable. When nearly the whole grid makes money before costs, something real is being sampled. A curve-fit produces a few lucky islands, not this.
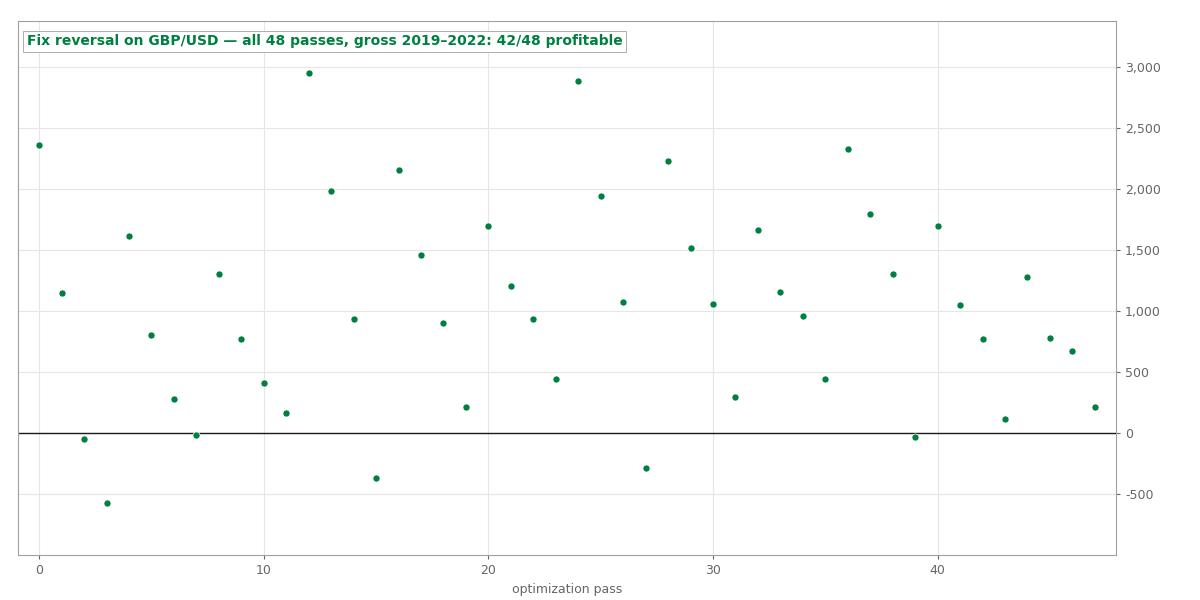 All 48 optimization passes on GBP/USD, gross profit 2019 to 2022. 42 of 48 configurations finished positive.
Then real ticks thinned the field. We shortlisted three parameter plateaus and re-ran each on tick-by-tick data before freezing anything, and two of the three died right there: M1-OHLC modeling had flattered their profit factor by 0.2 to 0.3, because spread widens exactly at the fix and eats the small-threshold variants. The survivor fades only moves of 15 pips or more, big enough that the fix-time spread does not decide the trade.
Out-of-sample: it held, and it didn't matter
The frozen candidate (fade 15-pip pre-fix moves, hold 30 minutes, 30-pip stop) went to the out-of-sample window once: 2022 to 2026, 142 trades.
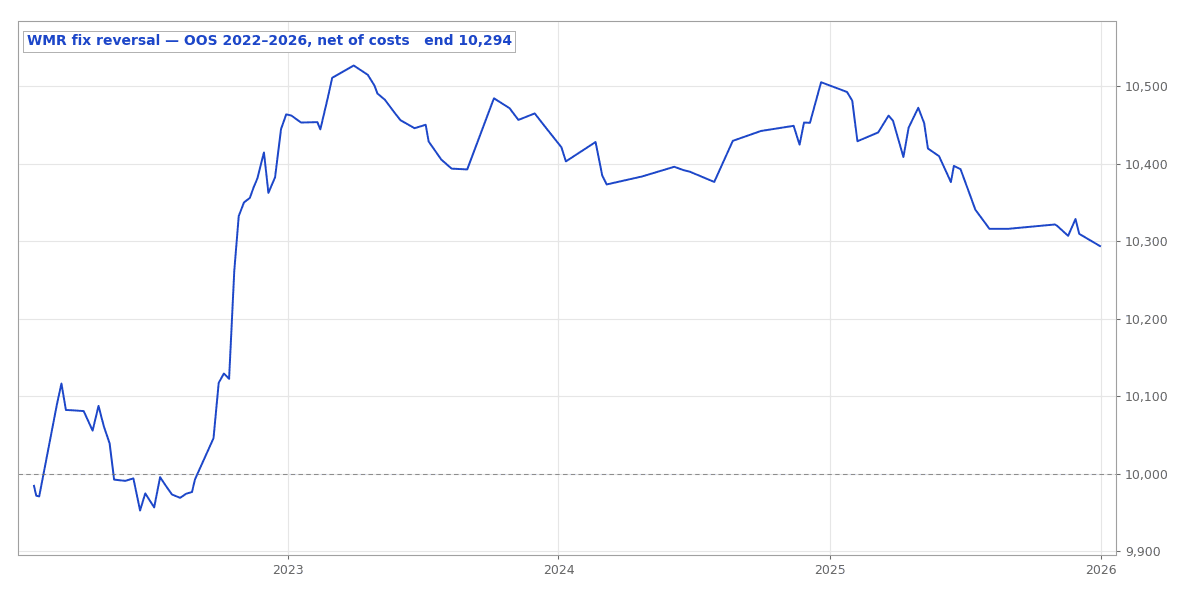
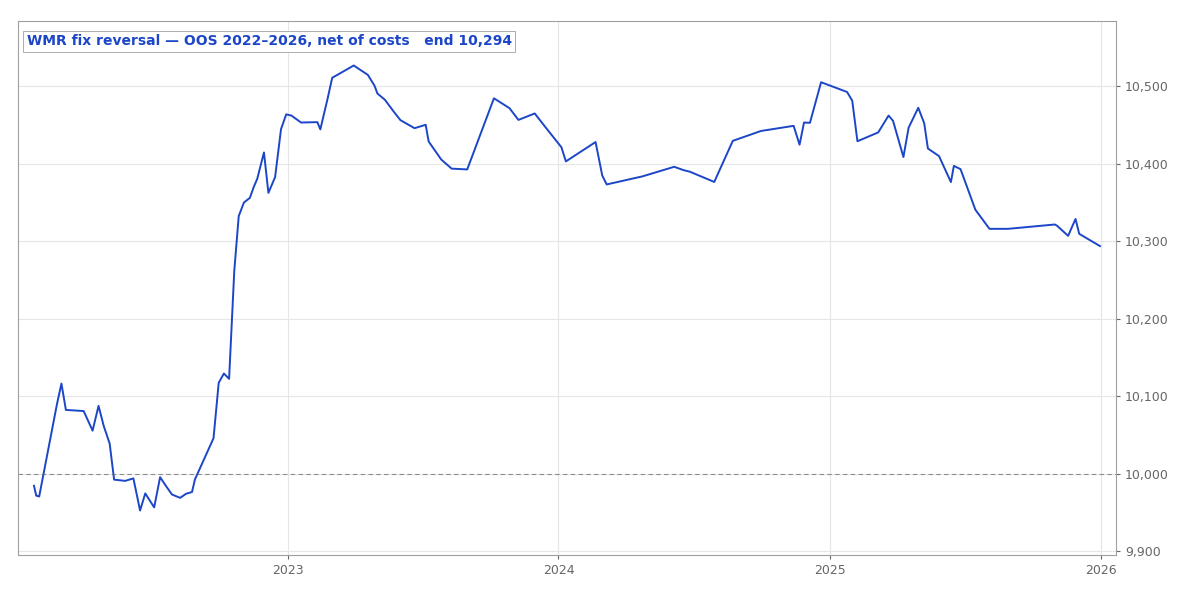 Out-of-sample equity, 2022 to 2026, net of modeled costs. Profitable, shallow, and visibly fading after 2023.
Net profit factor 1.225. Max drawdown 2.21%. Profit factor retention 0.88 against our 0.70 bar, which is the retention of a real effect, not optimization residue. Stress the commission from $3.50 to $8.50 a side and it still finishes positive. Eleven gates, eleven passes.
The twelfth gate asks a blunter question: how much money did the edge actually retain? In-sample it earned about 1.9% a year. Out-of-sample, about 0.74% a year. That is a return retention of 0.39 against our 0.5 minimum, and it was the single failure. At 0.5% risk per trade, the whole four-year out-of-sample window produced $293.55 on a $10,000 account.
Evans said the effect concentrates at month-end, and our data agrees: the 19 month-end trades in the out-of-sample window made $151.25 net with a 58% win rate. Half the profit from 13% of the trades. A month-end-only variant would be the pure play, but at roughly a dozen trades a year it can never reach our minimum trade counts, so it stays a footnote rather than a strategy.
What we take from it
First, the 2015 window-widening did its job. The pre-2015 literature describes something tradeable. The residue we measured is real but earns about 0.74% a year at 0.5% risk per trade, which is not enough to justify the operational risk of running it.
Second, in-sample robustness keeps proving necessary and insufficient. The 42-of-48 landscape was genuinely encouraging, and two of three plateau candidates still failed the moment real spread entered the picture. If we had frozen candidates on M1-OHLC results, we would have published numbers that were 0.2 to 0.3 of profit factor too good.
Third, "does it work" and "does it pay" are different questions, and gates have to ask both. A strategy that keeps 88% of its profit factor but only 39% of its return has not failed statistically; it has failed economically. That distinction is exactly why the return-retention gate exists.
The fix reversal now sits in our registry as the most instructive kind of negative result: proof the pipeline can detect a real effect, and proof that detecting one is not the same as finding an edge worth trading.