A Gold System With 28 Years of Published Results Met Our Tester. The Gradient Told the Real Story.
A filtered Donchian breakout on gold claims PF 1.85 over 28 years, costs included. Our grid lost in all 36 configurations, but monotonically less as we slowed it down. Where the edge lives, no gate can follow.
The user asked us to find a strategy with good published results and put it through the pipeline. The best-documented candidate we found was a gold breakout system with numbers most vendors never publish: XAUUSD daily, April 1998 to March 2026, 104 trades, 40.38% win rate, profit factor 1.85, with commission and slippage modeled. The mechanism is disclosed too: buy the 20-day-high close-breakout only when an EMA trend filter agrees, and exit on a chandelier trail (highest high minus a multiple of ATR, ratcheting up, never down).
Two things needed adapting. The exact tuned parameters sit behind a paywall, which matters less than it sounds: our pipeline optimizes parameters itself on the in-sample window. The real problem was frequency. Four trades a year on the daily chart can never reach the 150-trade in-sample minimum that makes a validation statistically meaningful. So we tested the identical mechanism at H4 swing scale, 10-to-40-bar channels, flagging the translation openly in the spec.
The implementation worked. The edge did not come with it.
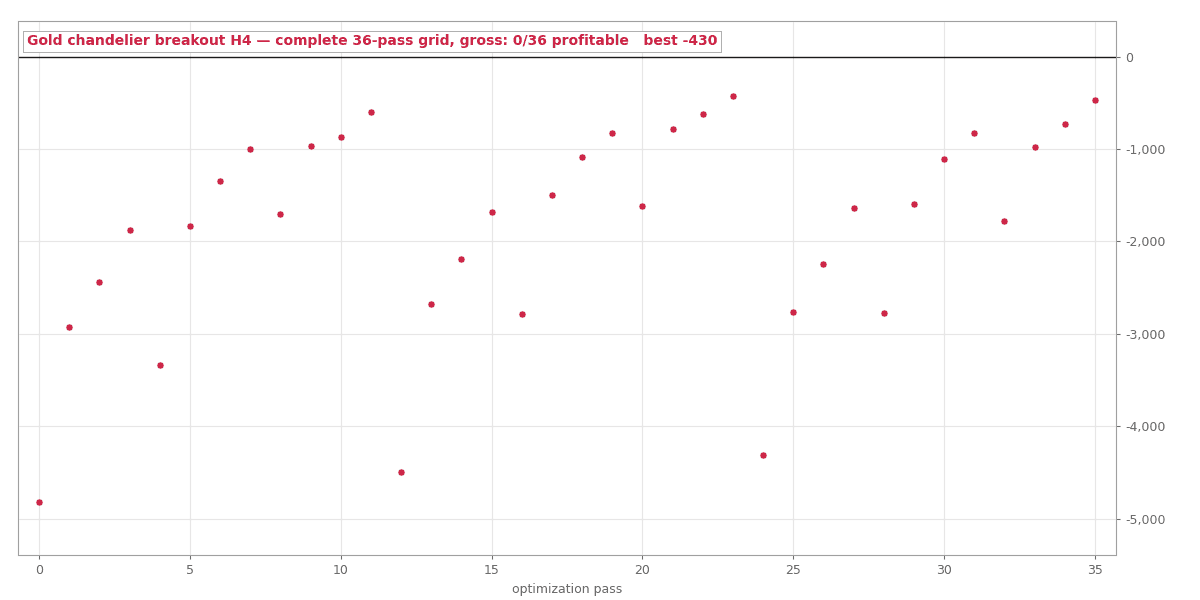
The smoke test on the 2020 bull leg was the system at its best: nine trades, profit factor 1.93, every winner exiting on a stop trailed above its entry, exactly as a chandelier should. Then the full 2019 to 2022 grid: zero of 36 configurations profitable. Best pass minus $430, worst minus $4,816.
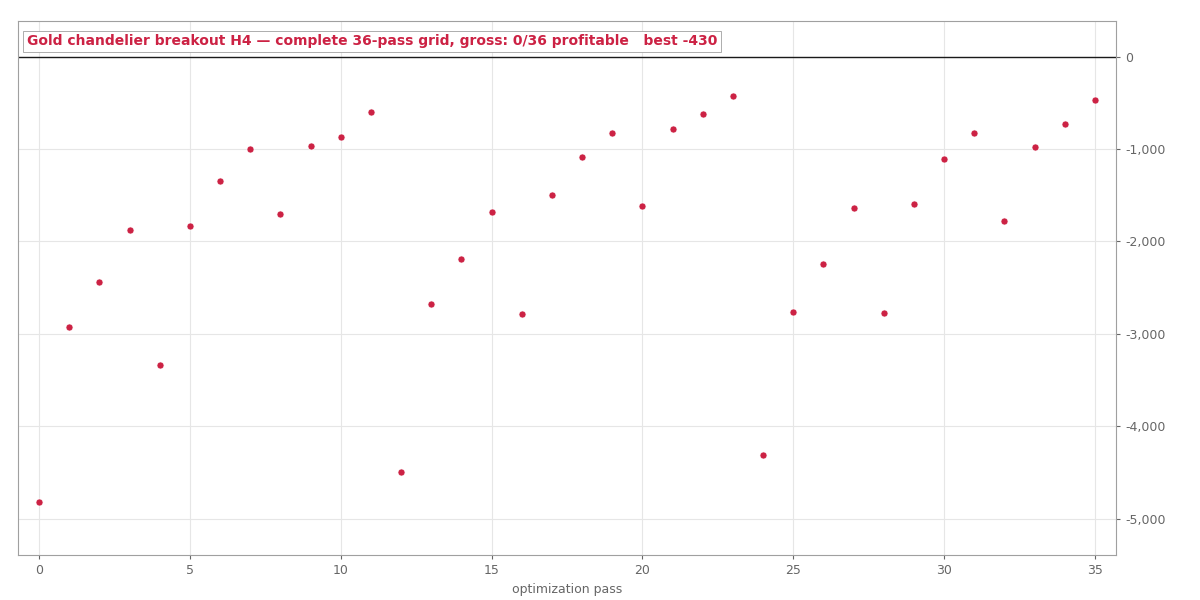 The complete 36-pass H4 grid, gross, 2019 to 2022.
What makes this rejection interesting is the shape of the failure. The landscape is monotone in both structural dimensions. Slower entry channels lose less, without exception: average result improves from minus $3,069 at 10-bar channels to minus $1,038 at 40 bars. Wider trails lose less, without exception: minus $2,838 at 2x ATR to minus $962 at 4x. The EMA filter, the source's headline fix, moved nothing at any period we tested.
The data is pointing, step by step, back toward the daily-chart regime the source ran, and that is precisely where our gates cannot follow: at 40 H4 bars the grid already produces only 56 trades in three years, a third of the statistical minimum, and the gradient wants slower still. Gold's trend edge, if it survives anywhere, lives at a speed where a single symbol cannot generate enough trades to validate.
So we ran their scale once, as a diagnostic
One in-sample-only run at the article's own dimensions: 20-day channel, 22-day chandelier at 4x. Thirty-nine trades over 2019 to 2022, net minus $199.66, profit factor 0.886. Flat to slightly negative, with real costs, on our window. The source's own equity description explains the gap: their curve was a "slow escalator" from 1998 to 2020 that went "vertical" after 2020. The 28-year profit factor is dominated by regime concentration, and our window happens to contain the chop that pays for those regimes.
What we take from it
Gold channel systems are now zero for 108 in this pipeline across two strategies and three speeds, while the identical mechanism was real (if mediocre) on Bitcoin at H4. The pattern that emerges: trend following behaves like a different strategy at every speed, and each market picks its own. Our response is structural rather than despairing: we pre-registered a longer in-sample window profile (2017 to 2022) for slow strategies in the 30-to-50-trades-a-year band, so the next swing-scale idea gets five years of sample instead of three, with every quality gate unchanged. For anything slower than that, honest validation on a single symbol is simply out of reach, whatever the published numbers say.