The Bitcoin Overnight Drift Is Documented at 33% a Year. Our Backtest Lost in All 48 Configurations.
A published BTC seasonality earns 33%/yr on exchange data. On CFD pricing, every configuration we tested lost money before commission. The spread is the whole story, and we measured it from raw ticks.
Quantpedia documents a Bitcoin seasonality that sounds too clean to pass up: go long at 22:00 UTC, hold two hours, go flat. On 2015 to 2021 exchange data that clock trade earned about 33% a year with a Sharpe of 1.58. The mechanism is plausible, too: major global exchanges are closed in that window, liquidity thins out, and systematic buying pressure has nowhere to hide. Concretum Group independently found clock-anchored BTC drift on 2018 to 2025 data. Two sources, one mechanism, fully mechanical rules. We specced it in an afternoon.
Every configuration lost
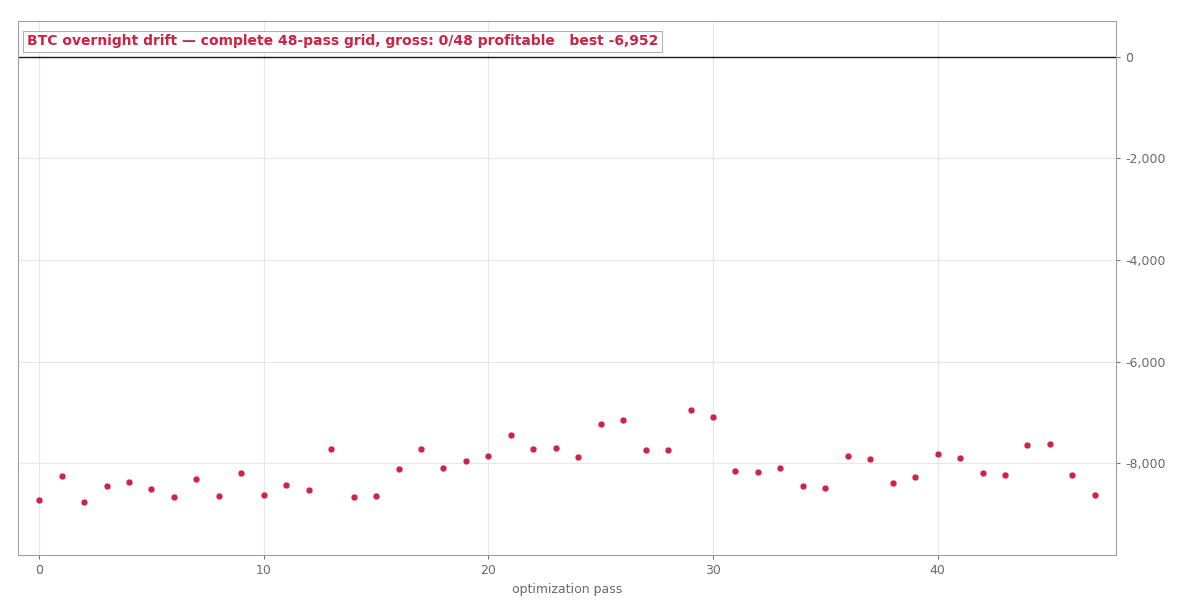
We ran the complete 48-combination grid on our 2019 to 2022 in-sample window: entry hours 20:00 to 23:00, holds of one to four hours, three stop widths. Zero of 48 were profitable, and not narrowly: the best pass lost $6,952 gross, the worst $8,755, on a $10,000 account. Not gross of spread, mind: "gross" in our tester means before modeled commission but after real bid-ask fills. That distinction turned out to be the entire story.
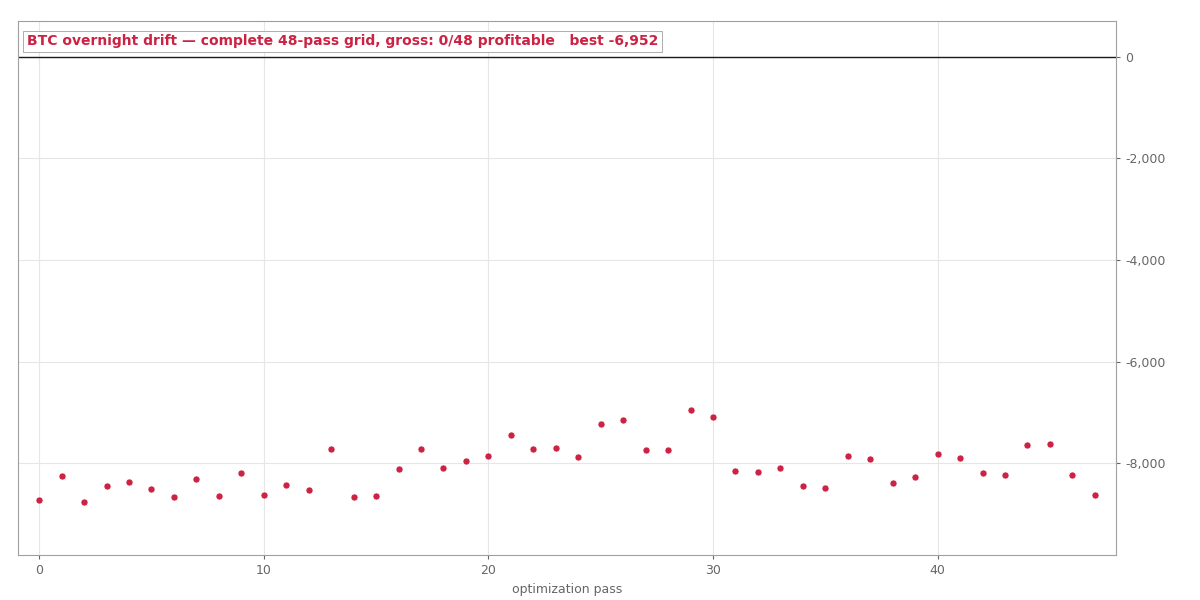 All 48 configurations, gross of commission, 2019 to 2022. There is nothing to optimize here.
The spread is bigger than the edge
When a documented anomaly fails this completely, either the anomaly is gone or the instrument can't reach it. So we measured the instrument, straight from the raw tick file:
| Date sampled | Median BTC spread | As % of price |
|---|---|---|
| June 2019 | $115 | 1.35% |
| June 2020 | $112 | 1.16% |
| June 2021 | $90 | 0.25% |
Flat across all hours of the day, entry window included. Now compare: the documented drift is roughly 0.2 to 0.4% per two-hour hold. On Dukascopy's CFD pricing, the round trip through the spread costs 0.25 to 1.4% of price. The strategy pays one to six times its expected edge in spread, every single night. Multiply ~$15 of average spread cost by 536 trades and you have essentially the entire gross loss.
The sources are not wrong; they backtested on exchange spot data where the spread is a hundredth of a percent. Whether the anomaly still exists there after 2022 is a question our data cannot answer. What it answers decisively: this anomaly cannot be harvested through CFD pricing, by anyone, at any parameter setting.
An honest wrinkle we found while auditing
Our post-run audit turned up a data defect worth disclosing: the BTC history inside our terminal has import gaps from 2019 through October 2020 (the raw tick files are complete; the import was not), so the grid effectively tested mostly late 2020 and 2021. We re-verified the verdict on the clean slice: 2021 alone, with full coverage and the tightest spread of the window at 0.25%, still lost $1,902 across 364 trades. The rejection stands on the cleanest year we have. The import gap is now a tracked pipeline defect, and new Bitcoin specs are embargoed until the history is rebuilt.
What we take from it
This is our second data point on the same lesson, after gold mean-reversion died the same death: the instrument is part of the strategy. A clock, a direction, and a holding period are only half a spec; the other half is whether your venue's cost structure leaves any of the move for you. For BTC CFDs the arithmetic is brutal: anything that holds for hours is spread food, and only multi-day systems (like our earlier Donchian test, the one BTC strategy that made money out of sample) clear the toll.